




 Request Quote



A recycling line can run smoothly and still miss its return target. The usual problem is not the ROI formula. It is the commercial boundary hidden behind the formula: which feed enters the model, where capacity is measured, which output is actually saleable, and which costs remain outside the supplier quotation.
For an aluminum project, those details matter more than a copied industry margin. Long profiles, mixed castings, thin sheet and wet turnings do not share one process route. A plant that only reduces volume earns value differently from a line that opens composite scrap, removes steel and produces a cleaner aluminum-rich fraction.
When the ROI model needs a practical equipment boundary, define the process around the scrap aluminum recycling line scope first, then price the modules, utilities, installation work and acceptance test against that same boundary.
The ROI Is a Margin Model, Not a Machine-Price Formula
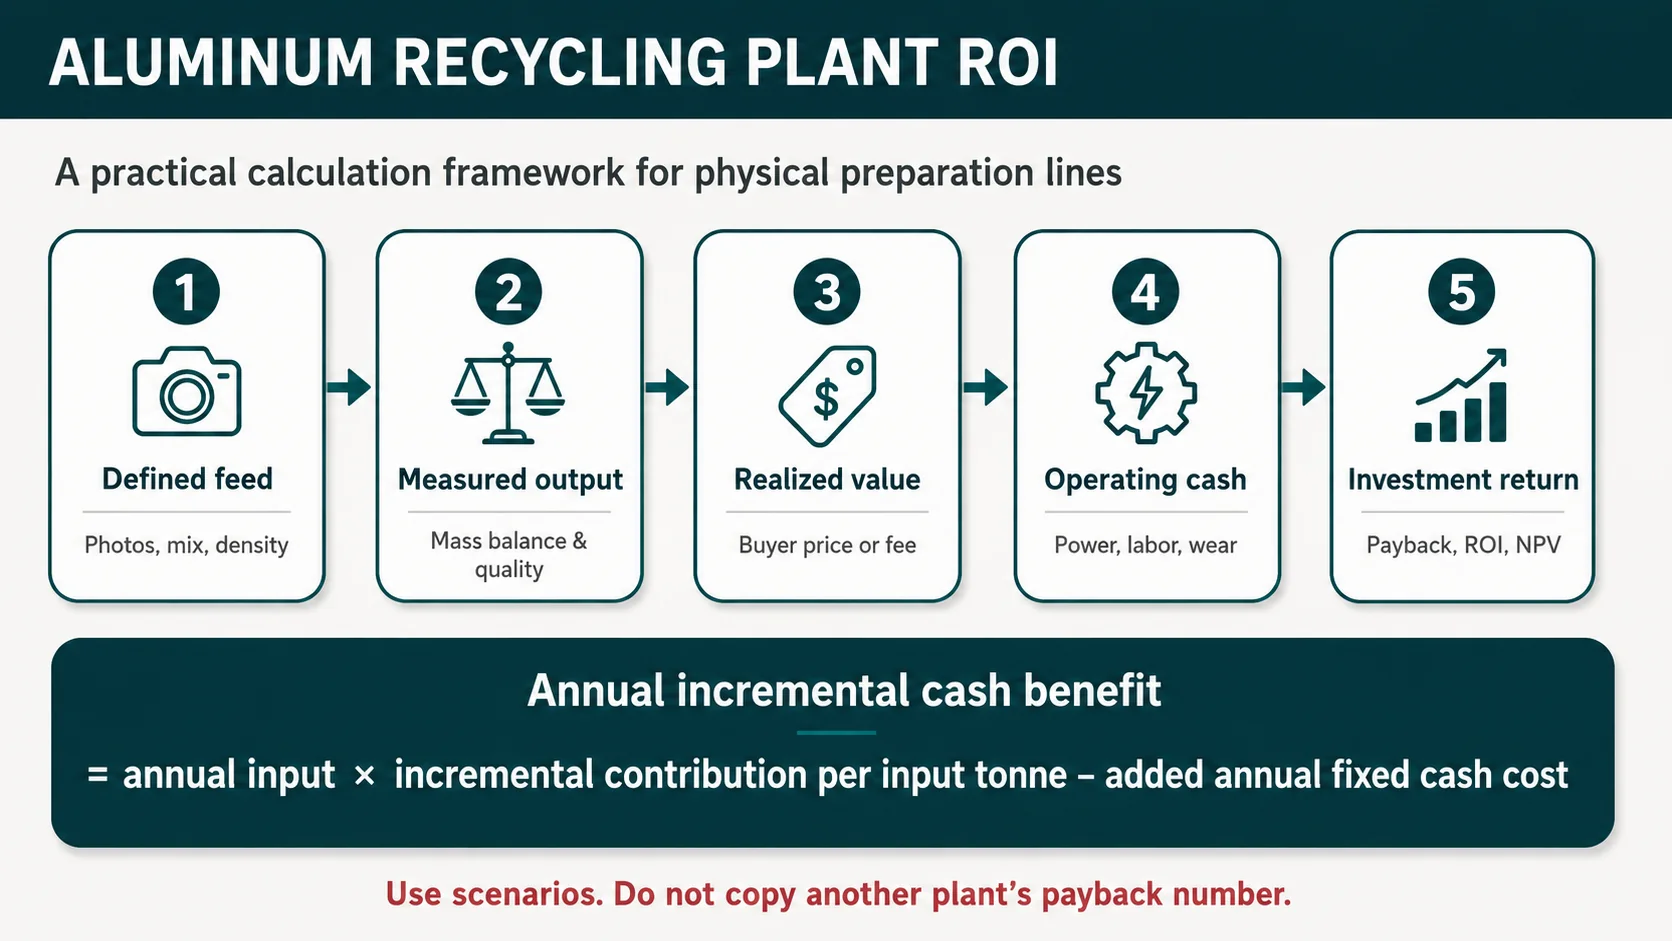
Aluminum recycling plant ROI should be calculated from incremental cash flow. First define the baseline: what happens to the same material without the proposed plant. Then estimate annual saleable tonnage, the change in realized value per input tonne, additional operating cash costs, annual fixed cash costs and the complete installed investment.
The practical core is:
Annual incremental cash benefit = annual input × incremental contribution per input tonne − added annual fixed cash cost
Simple ROI equals that annual benefit divided by total invested capital. Simple payback equals total invested capital divided by annual benefit. For longer projects, add discounted cash flow, ramp-up and residual value. A supplier’s equipment price alone is not the investment denominator.
Use the Revenue Model That Matches the Plant
A merchant recycler, a toll processor and a captive factory can operate similar equipment while earning return from different sources. Mixing their numbers produces a model that looks complete but answers the wrong question.
| Business model | Main economic input | Typical benefit | Common modeling error |
|---|---|---|---|
| Merchant processor | Purchased scrap cost and sale price of each output fraction | Margin between net output proceeds and feed plus processing cost | Using the clean aluminum selling price without deducting feed cost, residue and yield loss |
| Toll processor | Processing fee per accepted input or finished tonne | Fee revenue less variable and fixed processing cost | Adding customer-owned metal value as plant revenue |
| Captive internal recycler | Current outside processing, disposal, logistics and material-repurchase cost | Avoided cost, improved internal recovery and reduced handling | Valuing internal metal twice: once as avoided purchase and again as external sales |
| Upgrade of an existing yard | Current realized value and current operating cost | Incremental price, yield, volume or labor benefit | Modeling total future margin instead of the change from the existing operation |
We normally recommend building the model per input tonne first. That makes it easier to compare business models and prevents annual tonnage from hiding weak unit economics.
Five Equations Are Enough for the First Decision
The arithmetic is simple. The difficult work is collecting inputs that describe the same feed, operating period and product boundary.
1. Annual input
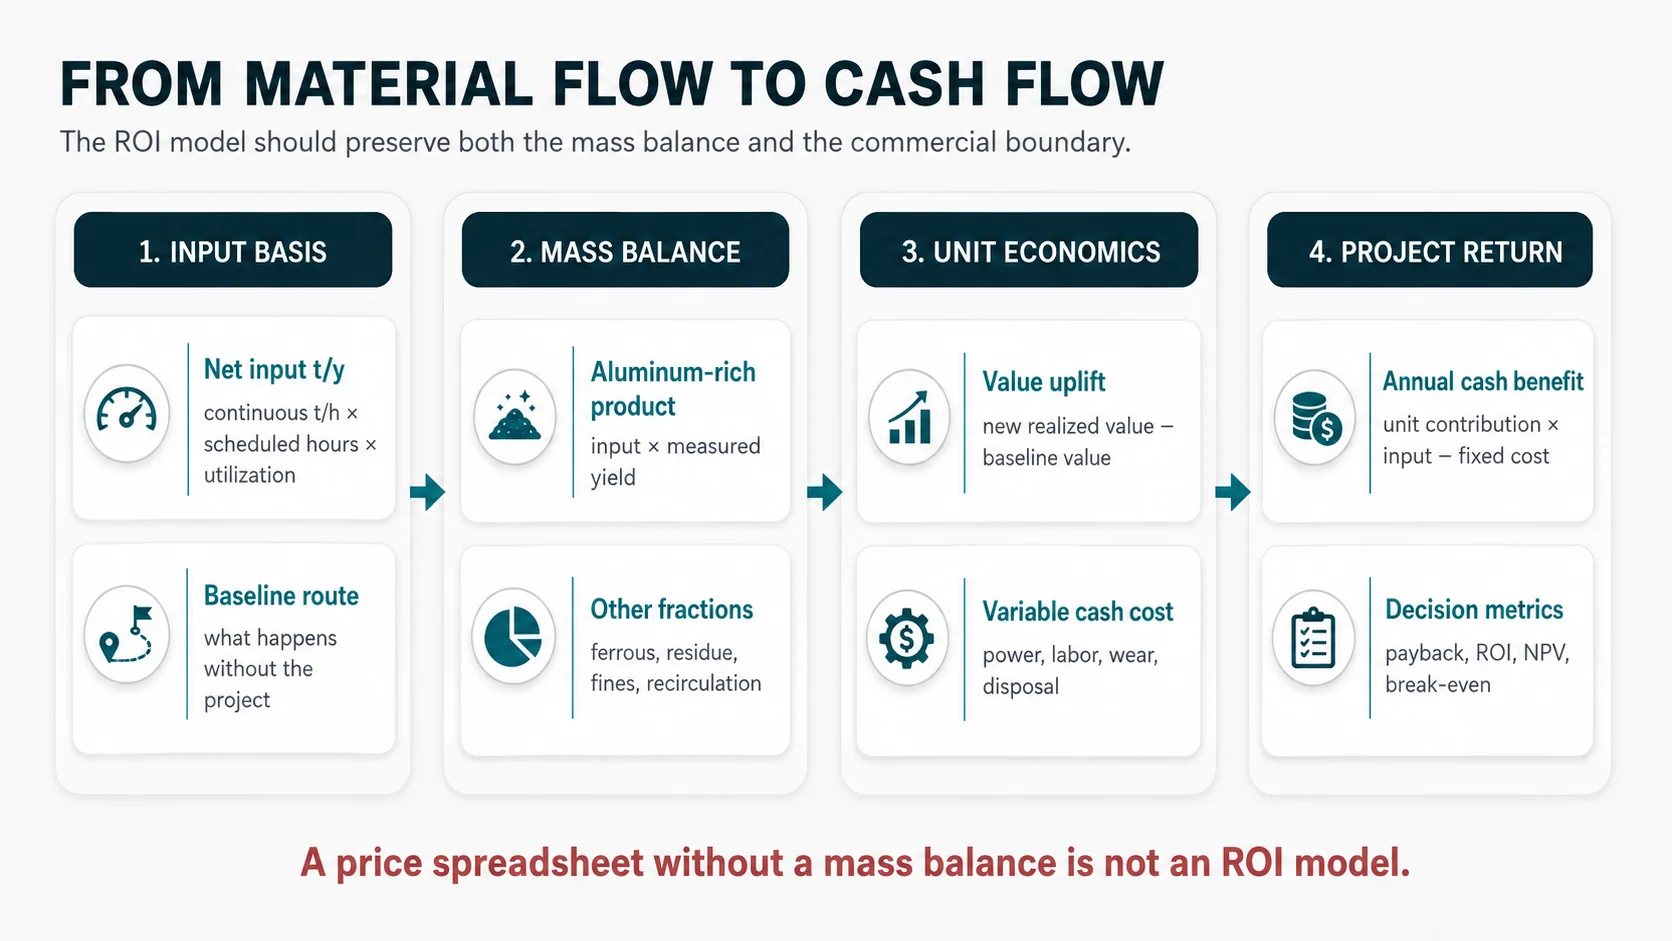
Annual input (t/y) = continuous line throughput × scheduled hours × productive utilization
Use the complete-line rate for the defined feed. Do not multiply a short peak test by every scheduled hour in the year. The separate aluminum recycling line capacity guide explains how bulk density, feed form, recirculation and downstream bottlenecks change practical tonnage.
2. Saleable output
Saleable output of fraction i = annual input × measured yield of fraction i
The fractions should close to a mass balance: aluminum-rich product, ferrous material, other recoverable metal, residue, fines, oversize and documented process loss. A purity claim without a yield is incomplete. So is a yield claim without a product specification.
3. Unit contribution
Incremental contribution per input tonne = value uplift + recovered by-product value + avoided cost − added variable processing cost
Value uplift is the difference between the new net realized output value and the baseline value. Use delivered or ex-works terms consistently. Include price deductions, packaging, transport and rejection risk where they sit inside your commercial boundary.
4. Annual incremental cash benefit
Annual incremental cash benefit = annual input × incremental contribution per tonne − added annual fixed cash cost
Fixed cash costs can include supervision, salaried operators, insurance, software, service contracts, building rent, environmental monitoring and other expenses that do not move directly with each processed tonne.
5. Return metrics
Simple ROI (%) = annual incremental cash benefit ÷ total invested capital × 100
Simple payback (years) = total invested capital ÷ annual incremental cash benefit
NPV = − initial investment + Σ [cash flow in year t ÷ (1 + discount rate)t]
Simple payback is useful for an early screen, but it ignores the timing of cash after payback. NPV is stronger when the asset life, ramp-up, financing and future overhaul costs matter.
Build the Model From Operating Evidence, Not Optimistic Percentages
Throughput: separate continuous rate from calendar availability
A three-tonne-per-hour line does not process 3 × 24 × 365 tonnes in a normal business case. Scheduled shifts, changeovers, feed gaps, cleaning, maintenance, blocked material and quality checks reduce productive hours. Use a downside utilization that reflects the feed and the maintenance organization, then improve it only when evidence supports the change.
Yield: weigh every commercial fraction
A mixed load may contain saleable aluminum, attached steel, dirt, plastic, moisture and unusable residue. Better liberation can move metal from residue into the product, but deeper crushing can also create fines and additional wear. The financially relevant number is saleable yield at the buyer’s accepted quality—not the percentage that merely reports to one conveyor.
Realized price: use contracts and net terms
USGS maintains aluminum supply, demand and price-related datasets, which are useful for market context.3 A plant model, however, should use the price the actual buyer will pay for the actual fraction at the stated location and volume. Exchange prices, published scrap indices and dealer quotes can inform scenarios, but none automatically equals net plant revenue.
Ask the buyer for the quality basis behind the price:
- Accepted material description and alloy restrictions
- Maximum steel, non-metal, moisture, fines or oversize
- Minimum shipment quantity and packaging form
- Delivery location, freight responsibility and payment timing
- Sampling method, rejection procedure and price deductions
Variable operating cost: model per input tonne
Power is visible, so it often receives too much attention. Wear parts, maintenance labor, screen changes, conveyor repairs, dust-filter service, loader fuel, residue disposal, packaging and reprocessing can be equally important. The aluminum recycling line maintenance checklist is useful for identifying tasks that should have labor, consumable and downtime allowances.
| Cost group | Suggested modeling basis | Evidence to request |
|---|---|---|
| Electricity | kWh per input tonne under representative loading × delivered electricity tariff | Connected load, measured load, duty cycle and local tariff structure |
| Direct labor | Operators per shift × loaded wage × scheduled hours ÷ annual input | Staffing plan, loading method, sorting duty and coverage for breaks |
| Wear and spares | Annual replacement budget or cost per processed tonne | Wear-part list, expected duty, feed exclusions and comparable service records |
| Maintenance | Planned labor, inspections, lubrication and shutdown work | Maintenance schedule, lifting requirements and local service capability |
| Residue and fines | Mass fraction × disposal or sale value | Representative mass balance and accepted disposal route |
| Logistics and packing | Cost by outgoing product form and shipment frequency | Bulk density, bale or briquette form, container loading and buyer location |
Total invested capital: use the installed and funded amount
The denominator should cover the project that must be paid for before stable production. The separate aluminum recycling plant cost guide divides that amount into core equipment, auxiliaries, controls, civil work, utilities, freight, installation, startup and working capital. Those layers should remain visible in the ROI workbook.
Supplier quotations should also be normalized before their numbers enter the model. Use the quotation comparison method to confirm that capacities, process stages, local work, commissioning and acceptance tests describe the same project.
Working capital and ramp-up: the two missing cash lines
A merchant processor may need cash to buy feed before it is paid for finished material. Inventory can sit in receiving, work in process, product bins and customer receivables. Add that cash requirement to the funded project even though it is not a machine.
Ramp-up also matters. The first months may run fewer hours, generate more rework and consume extra labor while feed rules and settings are stabilized. A model that starts at full output on the commissioning date is usually too clean.
Illustrative ROI Calculation: An Upgrade to an Existing Yard
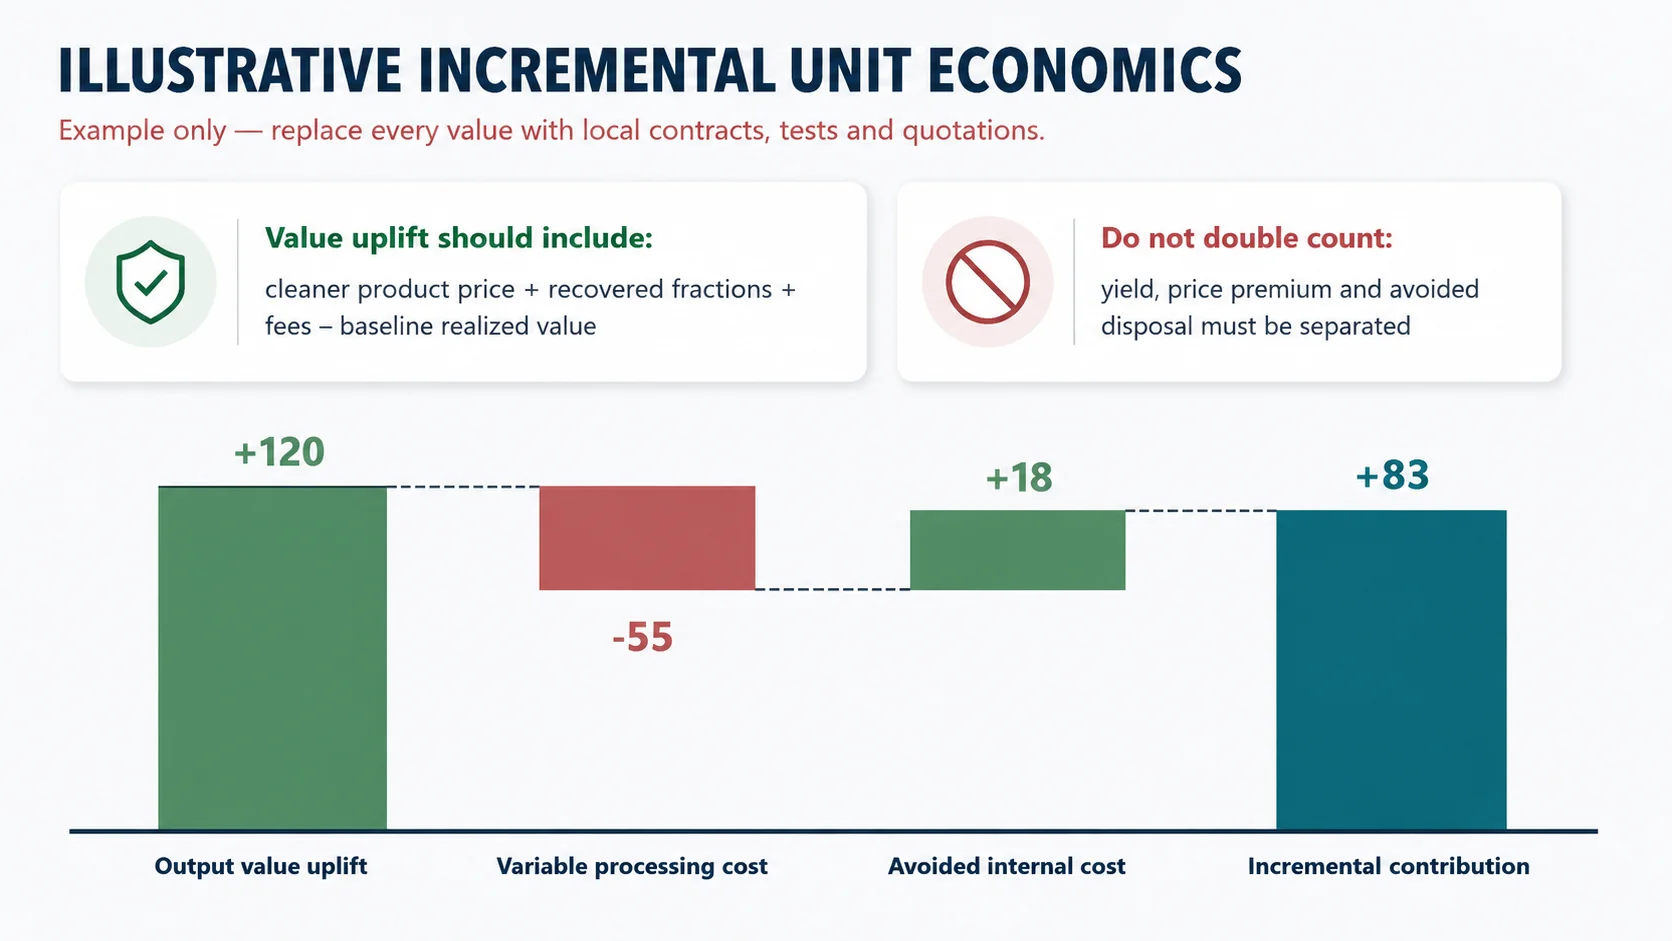
The following numbers are a teaching example, not a YUXI quotation, a market forecast or a promised result. They show how an existing recycler can evaluate a physical preparation line without pretending that the whole future selling price is created by the new equipment.
| Input | Illustrative base value | How it should be replaced |
|---|---|---|
| Continuous complete-line throughput | 4.0 t/h | Representative material test at agreed output quality |
| Scheduled operation | 10 h/day × 250 days | Actual shift calendar |
| Productive utilization | 80% | Downside/base/upside operating assumption |
| Annual input | 8,000 t/y | 4.0 × 10 × 250 × 0.80 |
| Incremental output value | $120/input t | New net realized value minus current net realized value |
| Avoided external processing and logistics | $18/input t | Current invoices and transport records |
| Added variable processing cost | $55/input t | Power, labor, wear, maintenance, residue and packing |
| Incremental contribution | $83/input t | $120 + $18 − $55 |
| Added annual fixed cash cost | $190,000 | Site-specific salaries, rent, insurance and overhead |
| Total installed investment and startup capital | $1,650,000 | Normalized project budget and working-capital need |
Annual incremental cash benefit = 8,000 × $83 − $190,000 = $474,000
Simple ROI = $474,000 ÷ $1,650,000 = 28.7%
Simple payback = $1,650,000 ÷ $474,000 = 3.48 years
At a 10% discount rate and a flat seven-year annual cash benefit, the illustrative NPV is about $658,000 before tax, financing, salvage value and major overhaul. That extra calculation does not make the assumptions more accurate. It only shows the time value of the cash flows already entered.
Break-even tonnage
The same model can answer a more practical question: how much material must the line process before the added annual fixed cash cost is covered?
Operating break-even input = $190,000 ÷ $83 = approximately 2,289 t/y
That break-even does not repay the investment. If management wants a simple five-year capital recovery before tax and discounting, the annual capital-recovery allowance would be $330,000. The required input becomes:
Five-year recovery input = ($190,000 + $330,000) ÷ $83 = approximately 6,265 t/y
This is often more useful than asking whether the catalog capacity “looks large enough.” It converts the investment target into a feed-security question.
Run the Downside Before Believing the Base Case
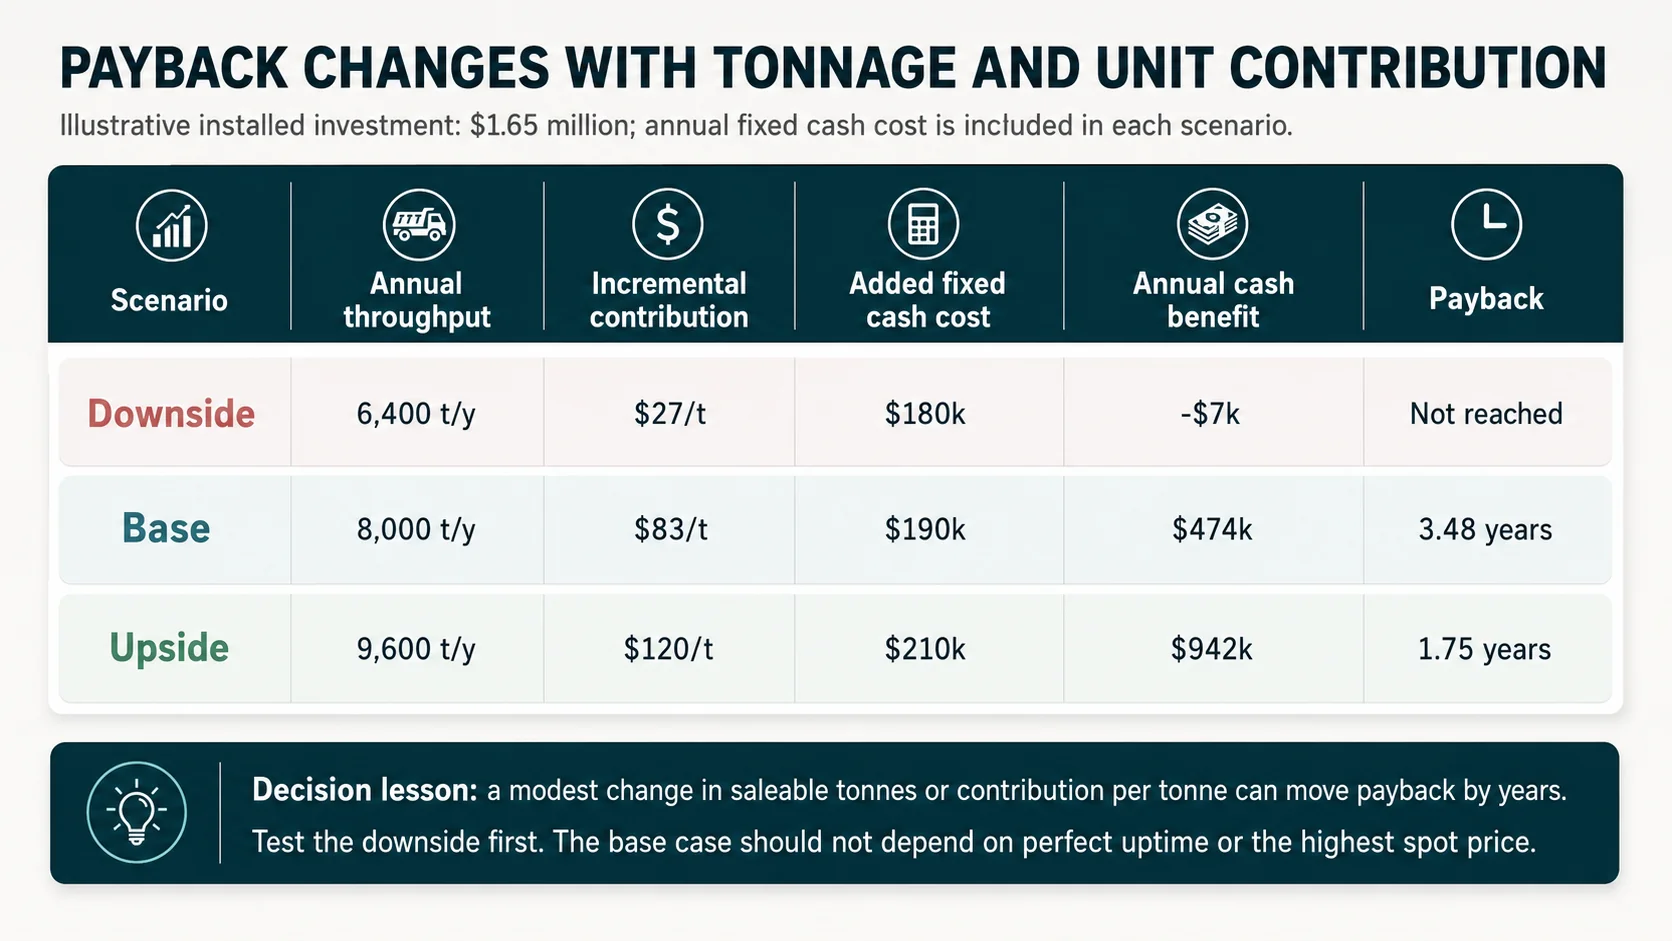
Aluminum projects are sensitive to both tonnage and unit contribution. A change in feed availability, product acceptance or residue cost can move payback by years even when the equipment price is unchanged.
| Scenario | Annual input | Incremental contribution | Fixed cash cost | Annual cash benefit | Simple payback |
|---|---|---|---|---|---|
| Downside | 6,400 t/y | $27/t | $180,000 | −$7,200 | Not reached |
| Base | 8,000 t/y | $83/t | $190,000 | $474,000 | 3.48 years |
| Upside | 9,600 t/y | $120/t | $210,000 | $942,000 | 1.75 years |
The downside case fails even though the plant still processes thousands of tonnes. That is the point. A return model should expose the combinations of feed and margin that make the project unacceptable.
Sensitivity variables worth testing separately
- Annual feed volume and the percentage secured by contract
- Continuous line rate and productive utilization
- Saleable aluminum yield at the accepted quality
- Product price or processing fee
- Purchased scrap price and payment timing
- Power, labor, wear and residue cost
- Ramp-up duration and first-year output
- Installed investment, contingency and working capital
Change one variable at a time first. Then create combined scenarios. This makes it easier to see whether the project is mainly exposed to feed volume, metal spread, operating reliability or capital scope.
Equipment Creates ROI Only When It Changes a Commercial Result
A longer equipment list is not automatically a better investment. Each stage should have a measurable job in the mass balance or operating cost.
| Process stage | Possible economic benefit | Cost or risk added | Evidence before purchase |
|---|---|---|---|
| Controlled feeding | More stable throughput, less idle time and fewer overloads | Hopper, feeder, controls and loader interface | Bulk density, maximum dimensions and loading video |
| Primary shredder | Volume reduction, opening and controlled downstream feed | Power, blade wear, maintenance and prohibited-item risk | Representative duty test and defined discharge condition |
| Secondary crusher or hammer mill | Additional liberation and more uniform separation feed | Higher power, wear, fines, dust and possible metal loss | Proof that primary reduction alone cannot reach the product requirement |
| Magnetic separation | Removal and sale of exposed ferrous attachments | Conveyor length, magnet access and ferrous handling | Measured ferrous fraction and liberation condition |
| Screening and recirculation | Controlled particle range and more stable separator performance | Extra conveyors, screen wear and circulating load | Size distribution and oversize balance |
| Eddy-current separation | Recovery of suitable non-ferrous pieces from a non-metal stream | Feed preparation, belt loading, maintenance and product handling | Representative sized sample and acceptance method |
| Baling or briquetting | Lower storage and transport volume; improved handling | Press investment, cycle time, fluid control and bale/briquette requirements | Logistics records and downstream buyer specification |
For variable post-consumer feed, the mixed aluminum scrap sorting line guide helps define where liberation, magnets, screens and non-ferrous separation belong. For a broader route decision, use the equipment selection guide before assigning financial benefits to individual machines.
Eight Errors That Make Recycling ROI Look Better Than It Is
- Using gross product revenue as project benefit. Deduct the feed value or compare with the existing route.
- Multiplying peak t/h by every calendar hour. Use scheduled hours and realistic productive utilization.
- Applying one recovery rate to every feed. Yield changes with contamination, liberation and product rules.
- Using a headline aluminum price. Model the net realized price of each accepted fraction.
- Ignoring reject and residue mass. Disposal or low-value handling can erase a price premium.
- Counting the same benefit twice. Yield uplift, price uplift and avoided cost need separate definitions.
- Using the equipment quotation as total capital. Add auxiliaries, site work, freight, startup and working capital.
- Assuming full output from month one. Model commissioning, operator learning and commercial qualification.
The SBA’s break-even guidance recommends separating fixed and variable costs and using realistic assumptions rather than treating the result as exact.4 The same discipline applies here: the value of the model is not a precise-looking percentage. It is the list of assumptions that management can verify, challenge and track.
Pause the Project When the Business Case Depends on an Unverified Link
A weak ROI does not always mean the equipment is wrong. It can mean the commercial sequence is incomplete. We would pause final approval when any of the following remains unresolved:
- No representative feed sample or mass balance is available.
- The annual feed volume is larger than secured supply and historical purchases support.
- The selling price assumes a quality the buyer has not accepted.
- The model needs 95–100% utilization to meet the payback target.
- The proposed process adds fine separation without a buyer for the finer product.
- Residue, dust or wastewater handling is outside every quotation and budget.
- The project boundary changes between competing offers.
- Working capital and customer payment timing have not been funded.
Sometimes the right decision is a smaller first phase. Controlled feeding, primary reduction and ferrous removal may solve the current commercial problem while preserving space and controls for later separation. Phasing is financially sensible only when the first phase has its own market and the later interfaces are designed, not merely hoped for.
Data Needed for a Site-Specific ROI Model
A supplier cannot calculate your profit from a material name and target tons per hour. YUXI can help define the process and installed scope, but the owner must provide the commercial inputs or label them as scenarios.
| Data group | Minimum useful information |
|---|---|
| Feed | Material categories, proportions, photos or video, maximum dimensions, bulk density, moisture, attached steel and non-metal contamination |
| Current baseline | Present sorting or processing method, current sale price, external processing charges, logistics cost, labor and reject history |
| Required product | Form, particle range, allowed contamination, sampling method, buyer, delivery terms and expected net price |
| Operating duty | Target net t/h, shifts, days per year, expected feed changes, loader method and maintenance window |
| Site | Voltage, frequency, floor and headroom, transformer capacity, civil scope, dust connection, cranes and local labor |
| Commercial boundary | Incoterm, freight, duties, installation, commissioning, spares, acceptance testing and owner-supplied work |
| Financial assumptions | Discount rate, funding cost, tax treatment, depreciation method, working-capital cycle and required payback threshold |
Build the ROI Model Around Your Actual Aluminum Scrap
Send representative material photos or video, current handling method, target throughput, required output, site data and the commercial assumptions you want tested. YUXI can separate the equipment scope, owner work and process acceptance points needed for a defensible calculation.
FAQ
How do you calculate aluminum recycling plant ROI?
Calculate the annual incremental cash benefit of the proposed line compared with the current or no-project baseline, then divide that benefit by total invested capital. Keep throughput, yield, prices, variable costs, fixed costs and startup capital visible instead of using one assumed profit margin.
What should be included in the investment amount?
Include the installed project boundary: process equipment, auxiliaries, controls, freight, duties, foundations, electrical work, installation, commissioning, initial spares, startup losses and the extra working capital needed to purchase feed and carry inventory.
Should ROI use nameplate capacity?
No. Use saleable annual output based on a defined feed, continuous tested throughput, scheduled hours, expected productive utilization and measured mass balance. Nameplate or peak rates are useful for screening equipment but weak for a financial model.
How should aluminum prices be used in the calculation?
Use the local net realized price under the expected quality, quantity, location, payment and delivery terms. Model a downside, base and upside case. Do not assume the plant automatically receives a primary aluminum exchange price.
What is a reasonable payback period for an aluminum recycling plant?
There is no universal period. The acceptable result depends on financing, feed security, buyer contracts, process risk, asset life and the owner’s required return. Compare the project with the company’s own approval threshold and test the downside case.
Can higher recovery always improve ROI?
Not automatically. Additional recovery is valuable only when the extra product is saleable and its value exceeds the extra capital, power, wear, labor, quality-control and residue-handling costs needed to obtain it.
Does this framework include an aluminum melting furnace?
Not by default. It is written for physical preparation lines such as shredding, sorting, baling and chip briquetting. A remelt project requires separate modeling for furnace yield, fuel or electricity, flux, dross, emissions control, alloy adjustment, casting, permits and metal inventory.
Authority Sources and Scope Notes
- U.S. EPA: AP-42, Section 12.8, Secondary Aluminum Operations — distinction between scrap pretreatment and smelting/refining.
- The Aluminum Association: Recycling — industry context on recycled aluminum and energy use.
- U.S. Geological Survey: Aluminum Statistics and Information — supply, demand, material-flow and market data resources.
- U.S. Small Business Administration: Break-Even Analysis — fixed cost, variable cost and contribution-margin framework.